Price Elasticity of Demand
Unit 2 · Demand, supply, elasticity and market equilibrium
Measuring how responsive quantity demanded is to a price change: point and arc elasticity, types by coefficient, determinants, and the effect on consumer outlay and producer revenue.
Elasticity of demand
The law of demand tells us the direction of the response to a price change. Elasticity tells us the size of the response. There are three kinds of elasticity of demand: price elasticity, cross price elasticity and income elasticity. This lesson covers price elasticity of demand (PED).
PED = % change in quantity demanded / % change in price
where % change = (change / original value) x 100.
Example. The price of a kind of fish rises from Rs. 100 to Rs. 120 per kg (+20%). Quantity demanded falls from 500 kg to 450 kg (-10%).
PED = -10 / +20 = -0.5
Because of the inverse law of demand, PED is normally negative. We compare the absolute value |PED|, called the coefficient.
Types of PED by coefficient
| Coefficient | Name | Meaning | Curve |
|---|---|---|---|
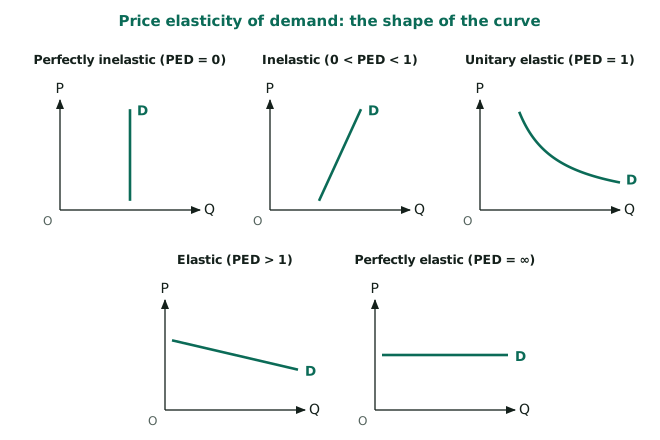
| 0 | Perfectly inelastic | Quantity does not change at all | Vertical |
| between 0 and 1 | Inelastic | % change in Q is less than % change in P | Steep |
| 1 | Unitary elastic | % change in Q equals % change in P | Rectangular hyperbola |
| more than 1 | Elastic | % change in Q is more than % change in P | Flat |
| infinity | Perfectly elastic | Consumers buy any amount at one price only | Horizontal |
Arc elasticity and point elasticity
Arc elasticity measures elasticity over a range of the curve, using the average (mid-point) of the old and new values so that the answer is the same in both directions:
PED(arc) = (change in Q / average Q) / (change in P / average P)
Example. Price rises from Rs. 10 to Rs. 14, and quantity falls from 60 to 40. Change in Q = -20; average Q = 50, so -20/50 = -40%. Change in P = +4; average P = 12, so 4/12 = +33.3%. PED = -40 / 33.3 = -1.2 (elastic).
Point elasticity measures elasticity at one point, using the demand equation:
PED(point) = (ΔQ/ΔP) x (P/Q)
where ΔQ/ΔP is the change in Q per Rs. 1 change in P, which is the coefficient of P in the equation Qd = a - bP, namely -b.
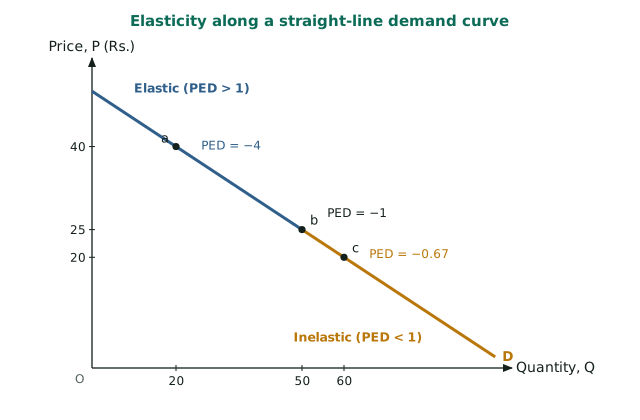
Example. Qd = 100 - 2P. At P = 20: Q = 60, so PED = -2 x 20/60 = -0.67 (inelastic). At P = 40: Q = 20, so PED = -2 x 40/20 = -4 (elastic).
Elasticity is not slope
This straight-line demand curve has the same slope everywhere (-1/2), yet the elasticity above is different at each price: elastic at high prices (where Q is small) and inelastic at low prices (where Q is large). Elasticity is a ratio of percentage changes; slope is a ratio of absolute changes. On a straight-line curve, elasticity is 1 at the mid-point, more than 1 above it and less than 1 below it.
Determinants of PED
- Availability and closeness of substitutes: more substitutes make demand more elastic (one brand of tea vs tea in general).
- Necessity or luxury: necessities (salt, medicine) are inelastic; luxuries (holiday trips) are elastic.
- Share of income: goods taking a small share of the budget (matches) are inelastic; big-ticket items (a car) are elastic.
- Time period: demand is more elastic in the long run, as consumers find alternatives.
- Definition of the good: narrowly defined goods (one brand of biscuit) are more elastic than broad groups (food).
PED, consumer outlay and producer revenue
A firm's total revenue (which is the same as consumer outlay) is TR = P x Q.
| PED | If price rises | If price falls |
|---|---|---|
| Elastic (more than 1) | TR falls | TR rises |
| Unitary (1) | TR unchanged | TR unchanged |
| Inelastic (less than 1) | TR rises | TR falls |
Reason: if demand is elastic, the percentage fall in Q outweighs the percentage rise in P, and so on.
Why PED matters
- Firms decide whether to cut prices (discount sales) or raise them.
- Government can predict how much revenue a tax on cigarettes, liquor or fuel will raise (inelastic demand gives high revenue).
- Farmers: a bumper harvest of an inelastic crop can reduce farm income, as prices fall more than quantity rises.
- Exporters and planners use elasticity to judge the effect of price or exchange rate changes.
Mind map
Remember:
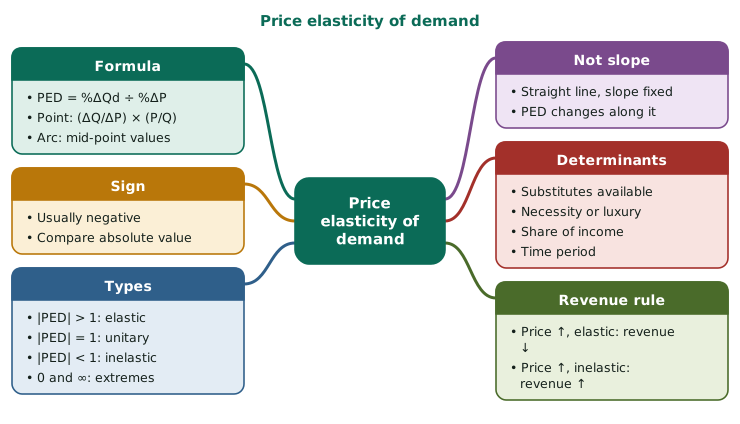
- PED = %ΔQd ÷ %ΔP
- |PED| > 1 elastic; = 1 unitary; < 1 inelastic
- Revenue rule: price rises → elastic demand means revenue falls, inelastic demand means revenue rises
- Elasticity ≠ slope: a straight demand line has a different PED at every point
- More elastic: more substitutes, luxury, big share of income, longer time
- Inelastic: necessities with no substitutes