The Factor Market
Unit 4 · Production, costs, market structures and factor markets
Demand for and supply of factors of production, determination of factor prices and earnings, transfer earnings and economic rent.
The factor market
Markets are of two kinds. In the goods and services market households buy what firms produce. In the factor market the roles are reversed: firms demand factors of production and households supply them, because households own the land, labour, capital and entrepreneurial skills.
| Factor | Price (payment) |
|---|---|
| Land | Rent |
| Labour | Wages and salaries |
| Capital | Interest |
| Entrepreneurship | Profit |
Factor earnings = factor price x quantity of the factor employed. The wages of the whole labour force, for example, are the earnings of labour.
Demand for a factor
Firms do not want labour or machines for their own sake; they want them to produce goods that consumers will buy. So the demand for a factor is a derived demand: it depends on the demand for the product it helps to make. The demand for tea pluckers depends on the demand for tea.
How many units of a factor should a firm hire? It compares what each extra unit adds to revenue with what it costs.
- Marginal revenue product (MRP) = marginal product (MP) x marginal revenue (MR). In a perfectly competitive product market MR = P, so MRP = MP x P.
- The firm hires more of the factor as long as MRP is greater than the factor price (e.g. the wage), and stops where MRP = factor price.
- Because of diminishing marginal returns, MP and hence MRP falls as more of the factor is hired. The MRP curve is therefore the firm's downward-sloping demand curve for the factor.
The demand curve for a factor shifts when:
- the demand for or the price of the final product changes (a higher tea price raises the MRP of tea pluckers),
- the productivity of the factor changes through technology, training or better management,
- the price of another factor that is a substitute or complement changes (cheaper machines may reduce the demand for labour).
Supply of a factor
- The supply of labour slopes upward: a higher wage attracts more people into the occupation and makes existing workers willing to work longer hours. The supply of labour to one occupation shifts with the wages in other occupations, the training and skills needed, working conditions, and the size of the population.
- The supply of land is fixed, and is perfectly inelastic in total.
- The supply of capital depends on savings and investment.
Determination of the factor price
The factor price and the quantity employed are set where the demand for the factor equals its supply.
Example. The labour market for a type of workers has demand W = 900 - 10L and supply W = 300 + 5L (W is the daily wage in Rs.; L is thousands of workers). At equilibrium: 900 - 10L = 300 + 5L, so 15L = 600 and L = 40 thousand. The wage is W = 300 + 5(40) = Rs. 500. Total earnings of labour = 500 x 40 = Rs. 20,000 thousand (Rs. 20 million) per day.
If the government fixes a minimum wage above Rs. 500, the quantity of labour supplied exceeds the quantity demanded, so unemployment results (the same logic as a price floor in the goods market).
Transfer earnings and economic rent
A factor's earnings have two parts:
- Transfer earnings are the minimum payment needed to keep the factor in its present use. They equal what the factor could earn in its next best use (its opportunity cost).
- Economic rent is the extra amount the factor receives above its transfer earnings. It is a surplus, like the producer surplus of the factor supplier.
Earnings = transfer earnings + economic rent.
Example. A skilled engineer is paid Rs. 150,000 a month. In her next best job she would be paid Rs. 100,000. Her transfer earnings are Rs. 100,000 and her economic rent is Rs. 50,000. If her pay fell below Rs. 100,000 she would move to the other job.
On a diagram, with the supply curve of a factor, the economic rent is the area above the supply curve and below the factor price (up to the quantity employed); the transfer earnings are the area under the supply curve.
How large the economic rent is depends on the elasticity of supply:
- If the supply of a factor is perfectly inelastic (such as the total supply of land in a country), a fall in its price would not reduce supply, so all of its earnings are economic rent and there are no transfer earnings.
- If supply is perfectly elastic, the factor can earn the same elsewhere at once, so all of its earnings are transfer earnings and there is no economic rent.
- For factors with rare skills, such as star performers, supply is very inelastic, so a large part of their earnings is economic rent.
Mind map
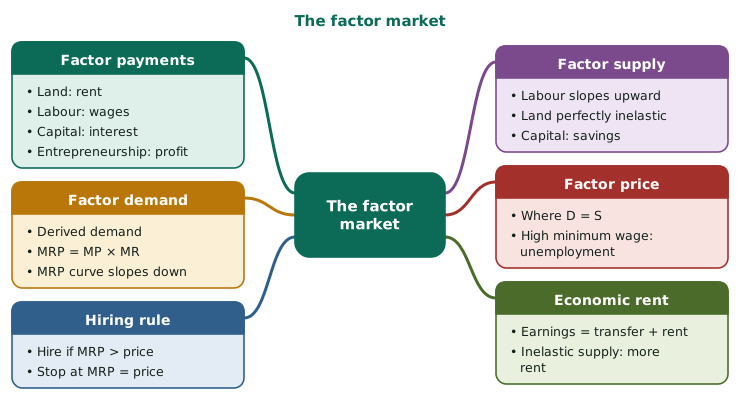
Remember:
- Factor payments → land: rent; labour: wages; capital: interest; entrepreneurship: profit
- Demand for a factor → a derived demand, from the demand for the product
- MRP = MP × MR (in perfect competition MR = P); the MRP curve is the factor demand curve
- Hiring rule → hire while MRP > factor price; stop where MRP = factor price
- Factor price → where demand = supply; a minimum wage above it causes unemployment
- Economic rent → earnings = transfer earnings + economic rent; the more inelastic the supply, the larger the rent