Changes in Market Equilibrium
Unit 2 · Demand, supply, elasticity and market equilibrium
How shifts in demand, shifts in supply, and simultaneous shifts of both change the equilibrium price and quantity, with numerical and graphical analysis.
A method for comparative-static analysis
When something changes in a market, follow these steps:
- A change in price alone is a movement along the curves, not a cause. Look for the determinant that shifted a curve.
- Identify the determinant that changed (income, tastes, cost, technology, tax, weather, expectations...).
- Decide which curve it shifts (demand or supply) and in which direction.
- Draw the new curve, find the new equilibrium and compare the new P* and Q* with the old ones.
Shift in demand
| Change | Cause (examples) | P* | Q* |
|---|---|---|---|
| Demand increases (shift right) | Higher incomes (normal good), rise in price of a substitute, favourable advertising, more buyers | Rises | Rises |
| Demand decreases (shift left) | Fall in incomes, fall in price of a substitute, health warnings | Falls | Falls |
At the old price there is now excess demand (or excess supply if demand falls). The price adjusts, which produces a movement along the supply curve to the new equilibrium.
Shift in supply
| Change | Cause (examples) | P* | Q* |
|---|---|---|---|
| Supply increases (shift right) | Lower costs, better technology, subsidy, good weather, more sellers | Falls | Rises |
| Supply decreases (shift left) | Higher costs, a tax, drought or cyclone, fewer sellers | Rises | Falls |
A worked numerical example
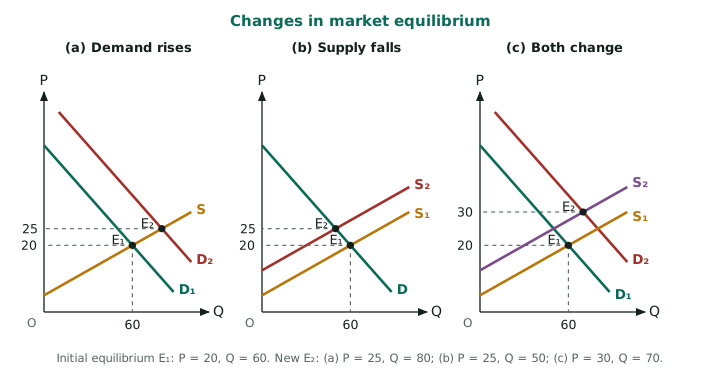
The market has Qd = 100 - 2P and Qs = 4P - 20, with P* = Rs. 20 and Q* = 60.
(a) Demand increases (incomes rise): Qd = 130 - 2P. Then 130 - 2P = 4P - 20, so 150 = 6P, giving P = 25* and Q = 80*. Both rise.
(b) Supply decreases (cost of fertiliser rises): Qs = 4P - 50. Then 150 = 6P, giving P = 25* and Q = 50*. Price rises, quantity falls.
(c) Both change together (demand to 130 - 2P and supply to 4P - 50): 130 - 2P = 4P - 50, so 180 = 6P, giving P = 30* and Q = 70*. Price rises sharply. Quantity also rises here (70 against 60), but with different slopes or different sizes of shifts it could have fallen: it depends on which shift is larger.
Both curves shift together
| Demand | Supply | Price | Quantity |
|---|---|---|---|
| Increases | Increases | Uncertain | Rises |
| Decreases | Decreases | Uncertain | Falls |
| Increases | Decreases | Rises | Uncertain |
| Decreases | Increases | Falls | Uncertain |
If both increase, quantity rises for sure (both curves push it in the same direction), but the price change depends on the size of each shift. When the shifts are in opposite directions (demand up, supply down), both push the price up, so it definitely rises, while their effects on quantity cancel, so quantity depends on the relative size of the shifts. Always say "uncertain" and explain, rather than guess.
Examples from Sri Lanka
- Avurudu season: demand for coconuts and sweets rises at the same time as heavy rain reduces supply: the price rises sharply, and quantity depends on the size of the shifts.
- Fuel subsidy or tax change: a fall in the cost of transport shifts supply of vegetables to the right and lowers prices.
- Tea exports during a drought: supply shifts left, auction prices rise.
- A good harvest of onions: supply increases, price falls, and farm income may fall when demand is inelastic.
Mind map
Remember:
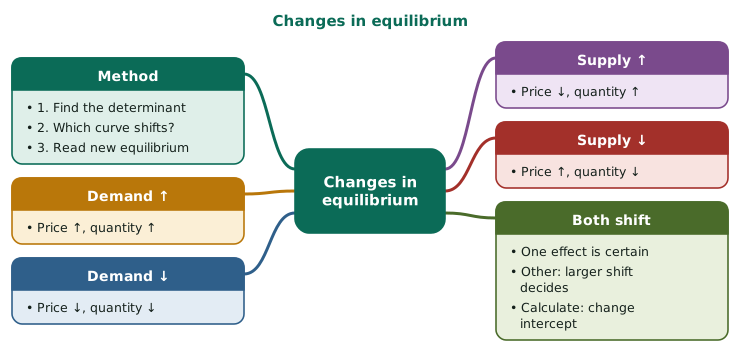
- Demand up: price up, quantity up. Demand down: price down, quantity down
- Supply up: price down, quantity up. Supply down: price up, quantity down
- Demand shift → price and quantity move the same way; supply shift → opposite ways
- Both curves shift: one change is certain, the other depends on which shift is larger
- Steps: find the determinant, pick the curve, pick the direction, read the new equilibrium
- To calculate: change the intercept of the shifted equation, then solve Qd = Qs