Grouped data: mean, median, mode and the coded mean
Work with class intervals, class boundaries and mid-values; estimate the mean (directly and by coding), the median and the mode of grouped data, and read the mode from a histogram.
Why group the data?
With many different values, such as marks out of $100$ for $50$ students, a table of single values is long. We group the values into class intervals and record how many fall in each class. The price is a loss of detail: from a grouped table we can only estimate the mean, median and mode.
Class boundaries, width and mid-value
For continuous data the classes meet, for example $0 - 10, 10 - 20, \dots$ with boundaries $0, 10, 20, \dots$. For integer data classes are written like $11 - 20, 21 - 30$; the class boundaries lie halfway between neighbouring classes, so $11 - 20$ really covers $10.5$ to $20.5$.
- class width $c = $ upper boundary $-$ lower boundary (here $10$);
- mid-value $m = \dfrac{\text{lower boundary} + \text{upper boundary}}{2}$ (here $15.5$).
Mean of grouped data
Every value in a class is taken to be its mid-value $m$, giving $$\bar{x} = \frac{\sum fm}{\sum f}.$$
Coding. Large mid-values make the arithmetic heavy. Choose an assumed mean $A$ (a convenient mid-value near the middle) and let $$y = \frac{m - A}{c}, \qquad \bar{y} = \frac{\sum fy}{\sum f}, \qquad \bar{x} = A + c,\bar{y}.$$ The $y$ values are small integers $\dots, -2, -1, 0, 1, 2, \dots$ for classes of equal width.
Marks of $50$ students (used in the examples below):
| Class | $0-10$ | $10-20$ | $20-30$ | $30-40$ | $40-50$ |
|---|---|---|---|---|---|
| $f$ | 4 | 10 | 16 | 12 | 8 |
Example: Estimate the mean mark in the table. The mid-values are $5, 15, 25, 35, 45$, so $\sum fm = 20 + 150 + 400 + 420 + 360 = 1350$ and $\bar{x} = \dfrac{1350}{50} = 27$. By coding with $A = 25$, $c = 10$: $y = -2, -1, 0, 1, 2$, $\sum fy = -8 - 10 + 0 + 12 + 16 = 10$, $\bar{y} = \dfrac{10}{50} = 0.2$, and $\bar{x} = 25 + 10 \times 0.2 = 27$. The two methods agree.
Median of grouped data
The median is the $\dfrac{n}{2}$th value. Find the median class, the first class whose cumulative frequency is at least $\dfrac{n}{2}$, then assume the values in it are spread evenly: $$\text{median} = L + \frac{\frac{n}{2} - F}{f},c,$$ where $L$ is the lower boundary of the median class, $F$ the cumulative frequency before it, $f$ its frequency and $c$ its width.
Mode of grouped data
The modal class has the greatest frequency (for equal widths). Then $$\text{mode} = L + \frac{d_1}{d_1 + d_2},c,$$ where $L$ is its lower boundary, $d_1 = f - f_{\text{before}}$, $d_2 = f - f_{\text{after}}$. The mode leans towards the neighbouring class with the larger frequency. On a histogram this is the point found by joining the top corners of the modal bar to the top corners of its neighbours.
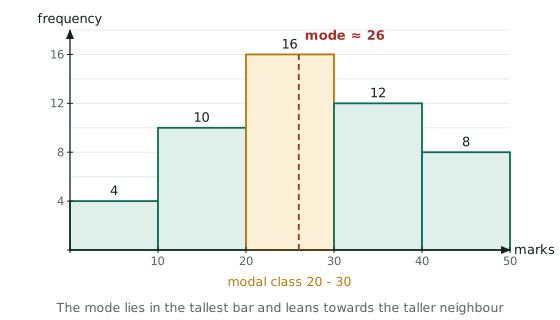
Example: Find the median and the mode of the marks above. $n = 50$, so $\dfrac{n}{2} = 25$. The cumulative frequencies are $4, 14, 30, 42, 50$, so the median class is $20 - 30$ with $L = 20$, $F = 14$, $f = 16$, $c = 10$: median $= 20 + \dfrac{25 - 14}{16} \times 10 = 26.875$. The modal class is also $20 - 30$ ($f = 16$) with $d_1 = 16 - 10 = 6$ and $d_2 = 16 - 12 = 4$: mode $= 20 + \dfrac{6}{6 + 4} \times 10 = 26$.
Example: Weights (kg) of $50$ people were recorded as $40 - 49$, $50 - 59$, $60 - 69$, $70 - 79$, $80 - 89$ with frequencies $5, 12, 20, 10, 3$. Estimate the mean, median and mode. The boundaries are $39.5, 49.5, \dots, 89.5$, the mid-values $44.5, 54.5, 64.5, 74.5, 84.5$, and $c = 10$. $\sum fm = 222.5 + 654 + 1290 + 745 + 253.5 = 3165$, so $\bar{x} = \dfrac{3165}{50} = 63.3$. Cumulative frequencies $5, 17, 37, 47, 50$ place the median in $59.5 - 69.5$: median $= 59.5 + \dfrac{25 - 17}{20} \times 10 = 63.5$. The mode: $d_1 = 20 - 12 = 8$, $d_2 = 20 - 10 = 10$, so mode $= 59.5 + \dfrac{8}{18} \times 10 \approx 63.94$.
Exam tip: Grouped-data questions are marked on method. Always list $m$ (or $y$), $fm$ (or $fy$), and the cumulative frequency in a table, and state the median or modal class before using the formula. For integer classes such as $40 - 49$, use the boundaries $39.5$ and $49.5$ in the median and mode formulas, not $40$ and $49$. Check that the answer lies inside the class you chose.