Graphs of basic functions and transformations
Sketching the standard graphs, and shifting, stretching and reflecting them to get the graph of a new function, including quadratics and modulus graphs.
The standard graphs
Learn these shapes well; every sketch in the exam starts from one.
| Function | Domain | Range | Shape |
|---|---|---|---|
| $y = x$ | $\mathbb{R}$ | $\mathbb{R}$ | straight line through $O$, gradient $1$ |
| $y = x^2$ | $\mathbb{R}$ | $[0, \infty)$ | U-shaped parabola, vertex at $O$, even |
| $y = x^3$ | $\mathbb{R}$ | $\mathbb{R}$ | S-shaped, flat at $O$, odd |
| $y = \sqrt{x}$ | $[0, \infty)$ | $[0, \infty)$ | half of a sideways parabola |
| $y = \dfrac{1}{x}$ | $x \ne 0$ | $y \ne 0$ | two branches, asymptotes the axes |
| $y = \lvert x \rvert$ | $\mathbb{R}$ | $[0, \infty)$ | V-shape, vertex at $O$ |
Transformations of $y = f(x)$
Starting from the graph of $y = f(x)$, each change of the rule moves the graph in a fixed way.
| New graph | Effect on the graph of $f$ |
|---|---|
| $y = f(x) + a$ | translate up $a$ (down if $a < 0$) |
| $y = f(x - a)$ | translate right $a$ (left if $a < 0$) |
| $y = -f(x)$ | reflect in the $x$-axis |
| $y = f(-x)$ | reflect in the $y$-axis |
| $y = a f(x),\ a > 0$ | stretch parallel to the $y$-axis, factor $a$ |
| $y = f(ax),\ a > 0$ | stretch parallel to the $x$-axis, factor $\dfrac{1}{a}$ |
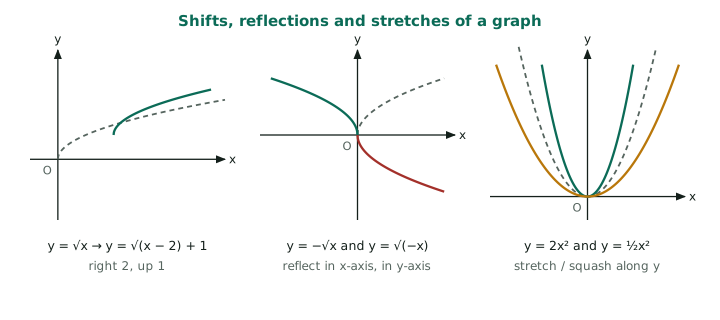
The sign of a change inside the brackets works the opposite way to what you expect: $f(x - 2)$ moves the graph to the right. It helps to track one point. A point $(p, q)$ on $y = f(x)$ goes to $\bigl(h + \tfrac{p}{b},; A q + k\bigr)$ on $y = A f(b(x - h)) + k$. So the changes inside the brackets act on $x$, and the changes outside act on $y$.
Example: Describe how to get the graph of $y = -2(x + 1)^2 + 3$ from $y = x^2$, and state the vertex and axis of symmetry.
Apply the steps in this order: (1) translate $1$ left: $y = (x+1)^2$; (2) stretch by factor $2$ parallel to the $y$-axis: $y = 2(x+1)^2$; (3) reflect in the $x$-axis: $y = -2(x+1)^2$; (4) translate $3$ up.
Answer: The vertex $(0,0)$ moves to $(-1, 3)$; the axis of symmetry is $x = -1$. The parabola opens downwards, so $(-1, 3)$ is the maximum point.
Example: The graph of $y = f(x)$ passes through $(0, 0)$, $(2, 3)$ and $(4, 1)$. Find the image of these points on $y = 2f(x - 1) + 1$.
$x - 1$ inside means each point moves $1$ to the right: $x \to x + 1$. $2f$ and $+1$ outside mean $y \to 2y + 1$.
$(0, 0) \to (1, 1)$; $(2, 3) \to (3, 7)$; $(4, 1) \to (5, 3)$.
Answer: $(1, 1)$, $(3, 7)$, $(5, 3)$.
Quadratic graphs
Every quadratic can be written $y = a(x - h)^2 + k$ by completing the square. The graph is $y = x^2$ stretched by $|a|$, reflected if $a < 0$, then moved so that the vertex is at $(h, k)$. The axis of symmetry is $x = h$. For $a > 0$ the vertex is the minimum point, for $a < 0$ the maximum point. The $y$-intercept is $ah^2 + k$ and the roots (if any) are the $x$-intercepts.
Modulus graphs
- $y = |f(x)|$: keep the parts of the graph on or above the $x$-axis, and reflect the parts below the $x$-axis upwards. The graph never goes below the $x$-axis.
- $y = f(|x|)$: keep the right half ($x \ge 0$) and reflect it in the $y$-axis to make the left half. The result is symmetric about the $y$-axis.
Example: Sketch $y = |x^2 - 4|$ and solve $|x^2 - 4| = 3$.
The graph of $y = x^2 - 4$ has $x$-intercepts $\pm 2$ and $y$-intercept $-4$. The part between $x = -2$ and $x = 2$ is below the axis; reflecting it gives a hump with maximum $4$ at $x = 0$. The line $y = 3$ cuts the sketch at four points.
Algebraically, $x^2 - 4 = 3$ gives $x^2 = 7$ and $x^2 - 4 = -3$ gives $x^2 = 1$.
Answer: $x = \pm \sqrt{7}$ or $x = \pm 1$: four solutions, matching the sketch.
Exam tip: In sketch questions mark the intercepts, the vertex or turning points and any asymptotes, and label the axes. A fast neat sketch with these features gets the marks; plotting many points does not. When asked for a transformation, apply the steps in the order the formula is built, and write down the image of one or two key points to prove you are right.